

Read PDF version here:
A K-shaped economy refers to a circumstance in which different consumer segments and industries grow at drastically different rates, creating a divergence like the letter “K”. Such an economy will see a high-income earner accumulating more wealth over time, while those at the lower end of the income spectrum find it increasingly difficult to afford essential goods and services.
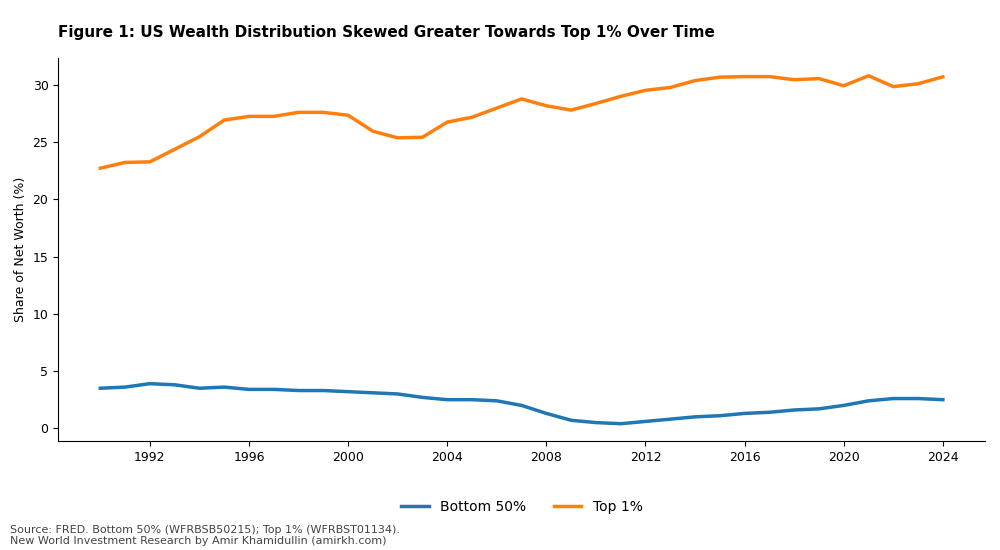
Over the past four decades, the share of net worth held by the top 1% increased from 23% to 31%, while the bottom 5% account for just about 4% net worth holdings. This factor alone provides important implications for the general economy and financial market. Therefore, this outlook will assess the extent to which the U.S. economy became K-shaped from various perspectives (incomes, consumption, investment, earnings) and provide implications for the financial markets as well as economic growth.
1: The United States Shows Strong Signs of a Bifurcated Economic Environment at the Consumer Level And…
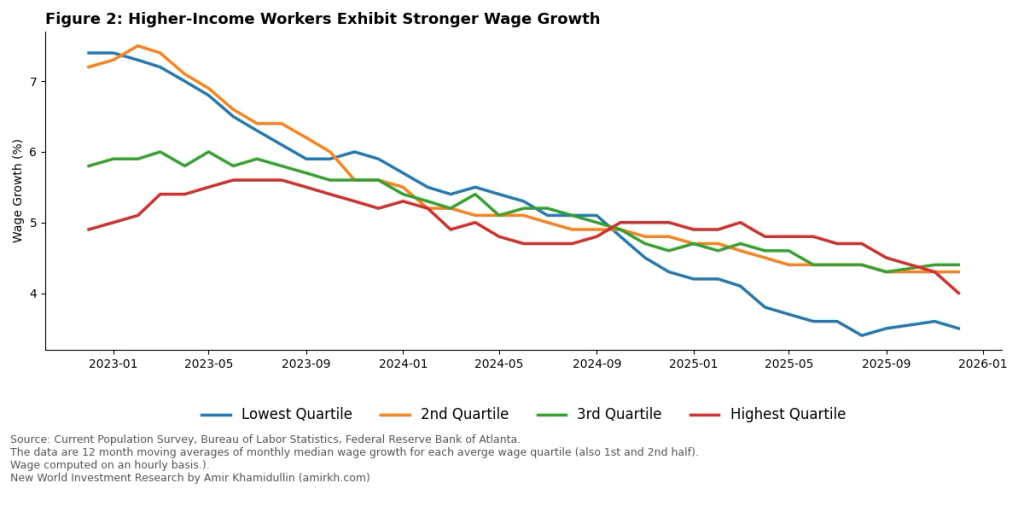
The lowest quartile of wage distribution in the US experienced a 3.5% wage growth year-over-year through December 2025 compared to about 4.3% rate in December 2024. High-income workers saw their wages rise by roughly 4.1% year-over-year in December 2025 with consistent outperformance in growth dynamics over all workers in other wage groups since September 2024. Figure 2 demonstrates that the opposite trend prevailed before September 2024 where highest wage earners trailed the rest.
The recent employment report data from Bank of America Institute supports these dynamics: after tax wage growth for high-income households was around 2% greater than that of lower-income households. BofA warned that the more crucial finding lies in middle-income group. The bank’s research institute found that the middle-income households’ after-tax wage growth was 0.4 pp below its second half 2025 average, implying that any sustained and structural decline in middle-income wage growth might provide headwinds for consumer spending. Although wage growth has slowed across all income quartiles, the highest quartile has continued to post relatively stronger gains in recent months, pointing to a gradual re-widening of wage differentials after a period of compression.
The estimated surge in electricity prices due to the buildout of AI datacenters and other related infrastructures is set to hurt low-income households the most as electricity costs take a greater proportion of their income. Estimates by Goldman Sachs Global Investment Research suggest that consumer electricity inflation will stick around 6% in 2026-2027 before decelerating to about 3% in 2028 on lower natural gas prices. However, although capital spent on infrastructure for data centers primarily benefits the data centers themselves rather than consumers, households, and non-AI businesses are expected to bear from about a third to an even half of the total excess capex costs required to service data centers. The government already intervened with policies to guard families and non-AI firms from these costs, but the effectiveness will be limited due to complexities in calculating and tracking the cost distributions.
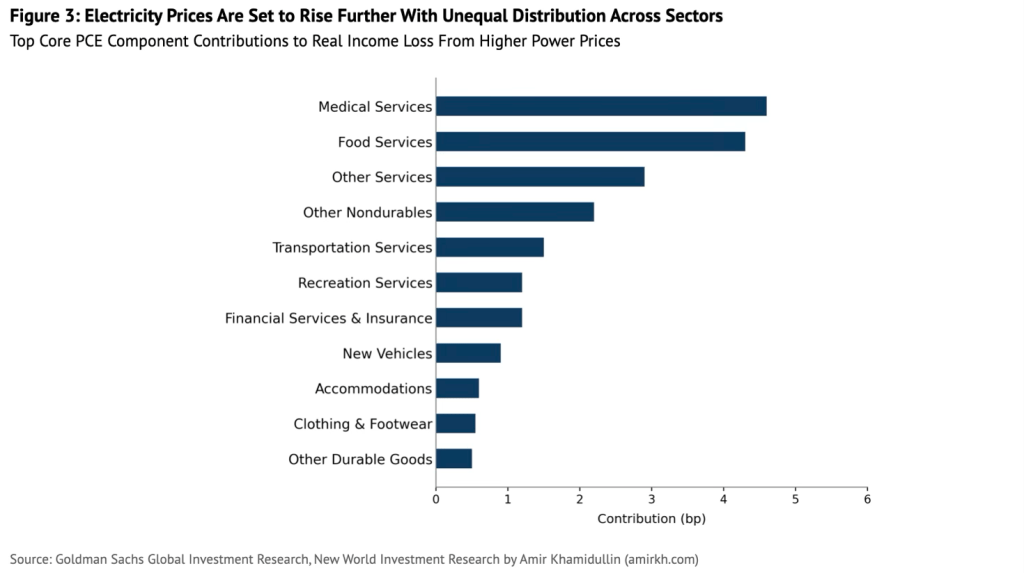
The more important factor is the impact of electricity prices on inflation. The same analysis by Goldman Sachs estimated the contribution to core Personal Consumption Expenditures (PCE) prices by industries from higher electricity costs. Figure 3 illustrates that ‘Medical Services’ along with ‘Food Services’ account for the greatest increases in PCE prices. This reinforces the argument for low-income households suffering the most from AI buildout through higher electricity prices, especially in essential areas such as medicine and food. While AI might provide with broader macroeconomic improvement, the impacts are yet to be seen. However, a soar in prices is already taking places and expected to continue, meaning that low-income households will continue to experience downward pressure on real incomes, while high-income earners will be largely unaffected, rather they might see themselves benefit from capital gains since they are generally more exposed to financial markets and assets.
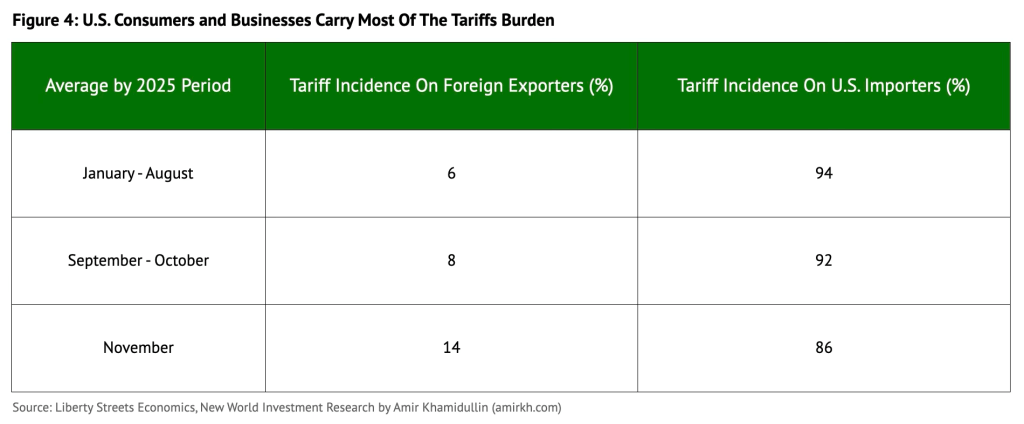
Absorption of ‘Liberation Day’ tariffs also highlights potential divergence in how different income groups see their living standards and purchasing powers. Despite the claims that tariffs will empower American consumers and business, the recent data points out that U.S. firms and consumers continue to bear a major part of the burden resulting from tariffs imposed in 2025 (Figure 4). Effectively tariff now act as a consumption tax on imported goods. Therefore, since lower-income consumers spend a larger share of income on tradable goods (appliances, clothing, households items) with lower savings and little opportunities for substitution – because US imports most of its consumer, capital and industrial goods, it is very likely the real income effect for lower-income groups will be more pronounced, leaving them even more vulnerable to changes in wages and prices.
This suppression dynamic in low-income households’ spending power is further supported by the most recent Black Friday and Thanksgiving data. Adobe Analytics reported that U.S. shoppers spent $6.4 billion on Thanksgiving Day and $11.8 billion online on Black Friday. Both are all-time highs and well above last year’s levels. However, separate data from Salesforce, showed that order volumes declined by roughly 1% year over year while average selling prices increased 7%, suggesting that the rise in total spending was driven primarily by higher prices rather than stronger consumer demand. In other words, consumers bought fewer items in this holiday season but paid a higher average price. More importantly, the October 2025 Beige Book – Federal Reserve System publication about economic conditions across the 12 Federal Reserve Districts – directly states that lower- and middle-income households are increasingly price-sensitive, actively searching for discounts amid persistent inflation and elevated economic uncertainty. Meanwhile, higher-income consumers continued to support strong demand for premium travel and lodging. Credit card data from Citigroup shows that expenditures on Citi-branded cards, which are typically used by customers with higher credit scores, have increased for four straight quarters, whereas spending on retailer-issued cards, which generally serve lower-credit-score borrowers, has declined during the same period.
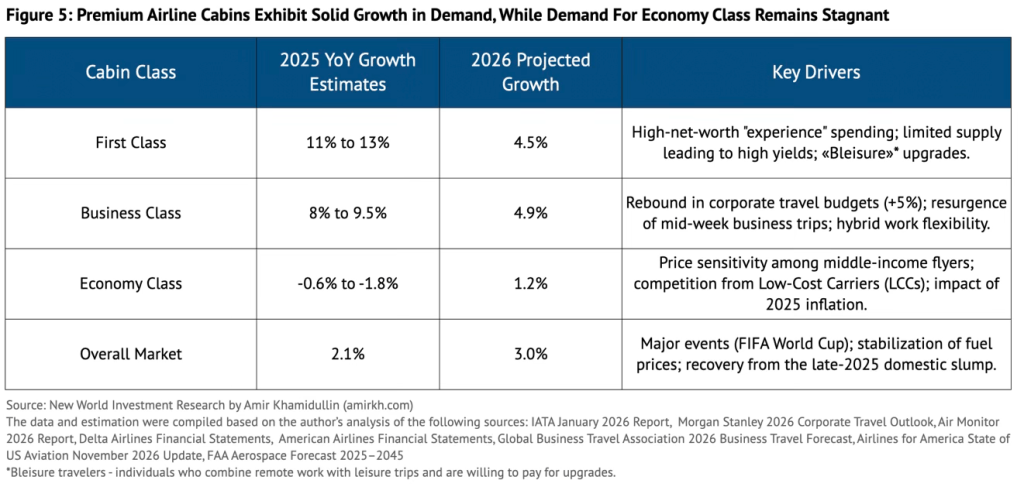
The demand for air travel among different cabin classes reinforces the K-shaped nature of spending in the economy. In 2025, First and Business Class expand at 8–13% YoY versus flat to negative growth in Economy, despite total market growth of only ~2%, indicating that higher-income households and corporate travelers are sustaining discretionary “experience” spending even as price-sensitive consumers retrench. This divergence suggests that aggregate demand growth masks widening income-based segmentation, with airlines increasingly reliant on premium yield expansion rather than broad-based volume growth.
The bottom line is that the data point to real purchasing power eroding at the bottom and stabilizing at the top with widening income differentials and making aggregate consumption growth increasingly reliant on affluent households.
2: …At The Corporate And Debt Market Level…
Apart from consumers, credit markets, investments and firms also experience the pervasiveness of the bifurcated economy. The S&P 500 is now being driven mostly by the AI story, with the 10 biggest stocks now making up 41% of the index’s market capitalization. Based on Apollo estimates, profit margins for the Magnificent 7 have been revised up over the last year, whereas the opposite has happened in the S&P 493. Moreover, spending on data centers has surged for years. While the pace has eased somewhat, growth remains robust, especially when set against other building categories, where construction activity has slowed since 2023 and turned negative throughout 2025. The same divergence is presented in real private fixed investment. While residential investment plunged sharply in 2022–2023 and remains weak, spending on information processing equipment has surged to around 20% year-over-year by 2025. This divergence suggests capital is rotating away from housing and traditional structures toward technology-driven investment, likely reflecting AI- and digital-infrastructure-led capex growth.
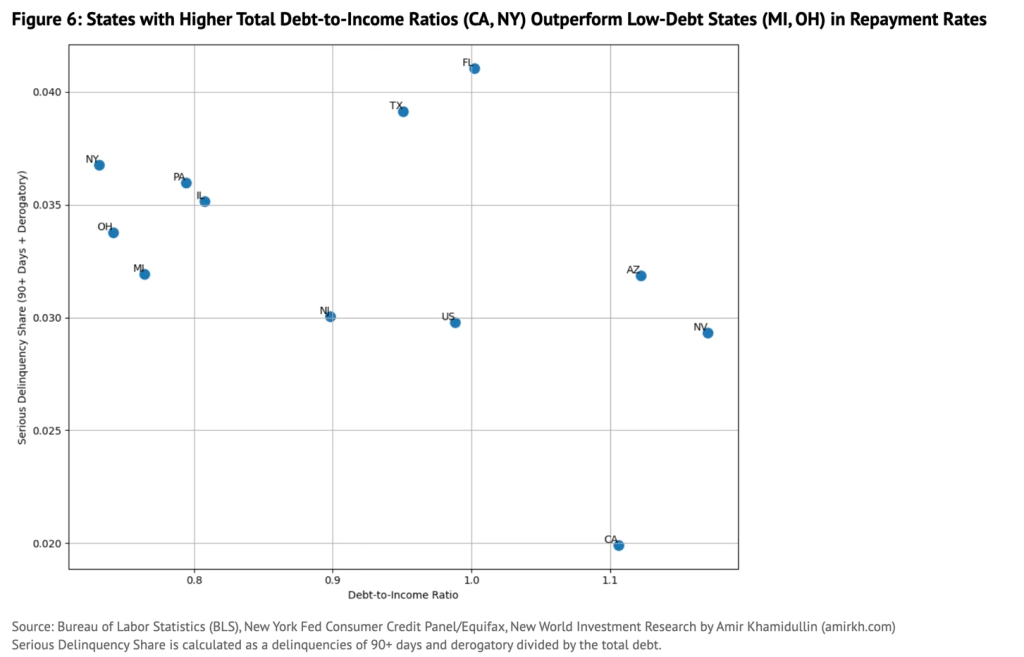
Figure 6 illustrates that delinquency rates are generally lower for states with higher debt-to-income rate while those rates are higher for states that exhibit lower indebtedness levels relative to income. While this factor alone doesn’t give clear implications of households’ ability to repay debt across the economy, it can be concluded that states like California and New Jersey are characterized by high leverage, but also high stability. The bottom branch of states like Texas and Florida is defined by lower leverage but high instability. Even modest debt becomes a crisis point due to income fragility and a lack of financial buffer. Ultimately, wealth, productivity, and leverage are positioned in selected states that use debt to propel further growth and investment.
Changing perspective from households’ debt to a corporate credit market, the data further supports that growth and resilience are narrowly placed with a need for selective picking. Based on the Apollo analysis, in the corporate sector, leveraged credit saw a significant drop in default activity in 2025. Total defaults and liability management actions amounted to $67.8 billion, marking a 19% decline from the previous year and remaining well below 2023 figures. This overall decrease was driven by an approximately 40% fall in distressed exchanges, which more than offset an around 30% rise in payment defaults.
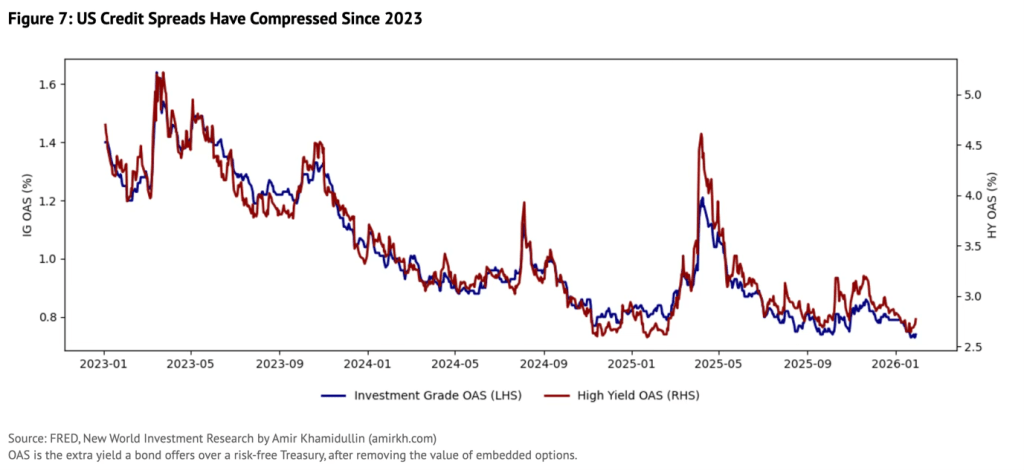
Moreover, option adjusted credit spreads have compressed to extremely low levels for both investment grade and junk bonds (Figure 7). While this indicates a robust corporate market for credit, the strength is still limited to a selected number of issuers. Over the past year, weaker CCC-rated issuers have experienced worsening leverage and interest coverage ratios, whereas stronger single-B and BB borrowers have generally improved, supported by more stable cash flows and stronger balance-sheet management.
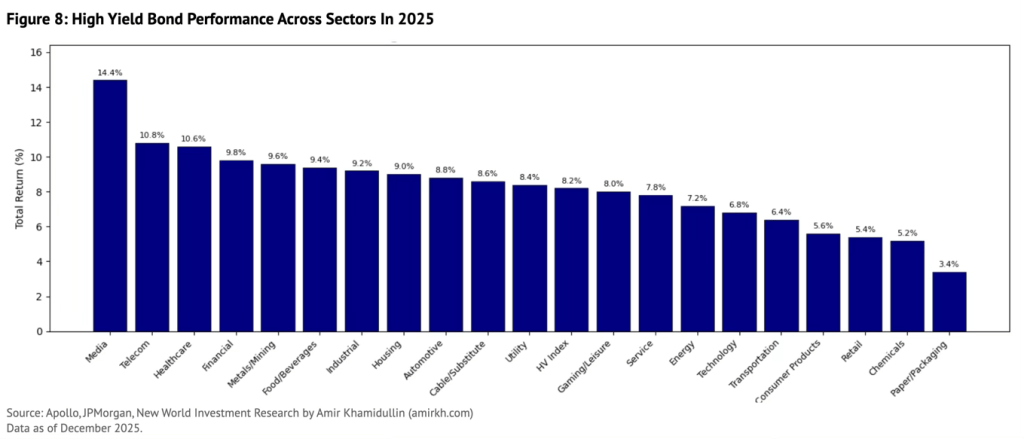
Performance within the HY Index was also highly uneven across sectors. Although the index rose about 8% through mid-December, returns differed significantly as investors exercised greater selectivity. Media outperformed, climbing over 14% thanks to strong M&A activity, while more cyclical and tariff-sensitive sectors like chemicals and packaging underperformed, posting gains below 5%.
The economy is sharply bifurcated – AI and tech-driven firms are thriving, driving S&P 500 gains and technology investment, while traditional sectors like housing and cyclical industries lag. Credit markets and corporate defaults are generally stable, but strength is concentrated in select high-quality issuers, and investor returns are increasingly uneven across sectors.
3: …Which Has Implications For Investments And Economic Growth
As growth becomes more concentrated and the gap between ‘leaders’ and ‘laggards’ is widening, investors should become even more cautions and move further away from broader themes and benchmarks. S&P 500 along with other major benchmark indices no longer offer the diversification they once did as markets become overly concentrated with only a few outperforming equities. Furthermore, K-shaped dynamics reinforce increased vulnerability of the U.S. economy and stock markets to sudden repricing and changes in earnings estimations, meaning that diversification towards other asset classes or markets is reasonable. This is already evident in surge of EM stocks and other non-US equities.
The K-shape narrative will continue to drive markets and the economy in 2026. The lagged effects of tariffs, higher energy costs and lower consumer sentiment will likely drag down real disposable incomes for many households in the lower wage distribution quartiles, meaning that consumer discretionary firms might see their sales coming down. Firms producing goods and services, targeting high net worth individuals, are set experience a rise in revenues. The economic growth, which is currently projected at about 1.7% – 2.6% for 2026, is likely to come from U.S. government fiscal spending and investments from hyperscalers as well as related industries. Other industries, however, are likely to stagnate and lag.
For those looking to invest in credit, this divergence is not a red flag; rather, it is the very process that creates favorable investment opportunities. This environment is not characterized by panic selling or systemic distress, but by deliberate selection. In the realm of credit, when the market is driven by choice, it consistently works to the advantage of the buyer.
Disclosures
This report is for informational purposes only and does not constitute investment advice or a recommendation to buy or sell any security. The views expressed reflect the authors’ judgment as of publication and may change without notice. Information is believed to be reliable but is not guaranteed for accuracy or completeness. Past performance is not indicative of future results. The authors or affiliated entities may hold positions in the securities discussed. Recipients should consider their own financial circumstances and consult professional advisors before making investment decisions.
Amir Khamidullin
amirkh.com

Leave a comment