
Weak pricing from Chinese exporters, combined with a depreciating RMB against the euro, has driven a rapid rise in EU import volumes from China, putting significant pressure on European producers that struggle to compete on cost. Since early 2025, exchange-rate movements alone have explained around half of the growing gap between EU import volumes and import values from China.
In Q3 2025, the value of EU imports from China increased by just 0.2% year-on-year, while import volumes rose by 7%, highlighting the scale of price compression. At the same time, EU export values to China declined by 6%, reflecting weak Chinese domestic demand and increasingly unfavorable relative prices for European firms.
Persistently low Chinese import prices are not only eroding the competitiveness of EU producers but are also undermining diversification efforts. Euro-denominated prices of Chinese goods have fallen faster than those of alternative suppliers, making it harder for European buyers to shift sourcing away from China even when policy incentives exist.
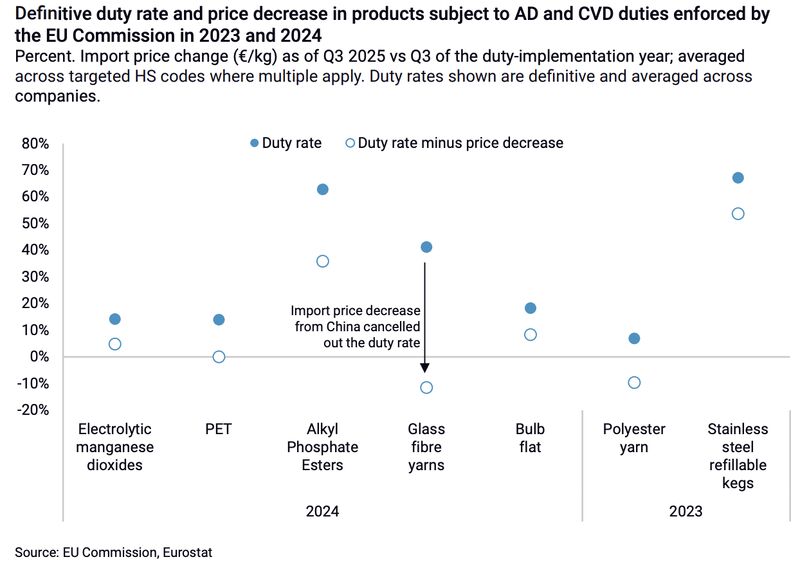
Deflation in China and RMB depreciation are also reducing the effectiveness of EU trade defense instruments. Although duties imposed after investigations may initially offset non-market pricing, subsequent declines in euro-denominated import prices can quickly eliminate their protective effect. These adjustments occur far more rapidly than trade defense reviews, which typically take place only every few years.
In practice, falling import prices have already neutralized tariffs in three out of seven EU trade defense cases involving Chinese imports in 2023–24, excluding electric vehicles. In four of the seven cases, import volumes from China continued to expand over the past year. Shipbuilding-related steel products such as bulb flats recorded 68% year-on-year growth, while imports of polyethylene terephthalate (polyester) surged by 210%, underscoring how price dynamics continue to drive volumes despite existing duties.
***
Chart and data source: Rhodium Group

Leave a comment